Visualizing Motion
Thursday, 29 November 2012
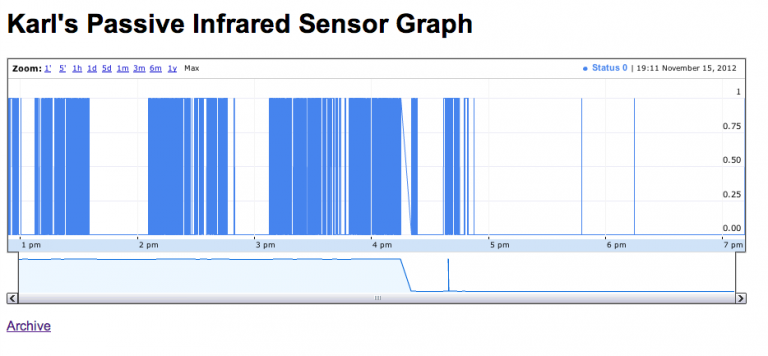
The programmability of the Raspberry Pi comes in handy when you want to change the behavior of a circuit without moving a single wire. In this case, I decided the data I was logging with my former motion detection script was largely useless because it only ever recorded when a motion event occurred, but didn’t hint to how long it had happened for.
So, while I admit the new method probably isn’t the -best- way there is, I believe it to be incrementally better. 🙂 The main difference being that “sleep” is called for half a second in the mix to allow for the line to start at bottom, progress to top, and then back down after the event occurs. I suppose it is inaccurate in that motion didn’t actually happen exactly in this manner, but it does allow for a nicer graph. Google Chart Tools is used along with the PHP built-in web server effectively piping the “data.js” log file to Google for displaying. I know the Pi has to be online…
Finally every evening at 23:59, cron runs a maintenance script and moves the data around for archiving (I love this little linux box). My thoughts on further improvements have been pointing me toward PHPlot instead of the Annotated Time Line from Google or maybe even utilizing kst. Also I would like to avoid that half second delay in future revisions… oh, and I haven’t tested what happens if I dance around in front of the thing right at midnight. 🙂
source for motion.sh
#!/usr/bin/env bash

function setup {
  gpio export 17 out
  gpio -g write 17 1
  gpio export 18 in
  start=0
  echo The PIR sensor is initializing and calibration has begun.
  i=0; while [[ $i -lt 40 ]]; do i=$(($i+1)); echo $i; sleep 1; done
}

function loop {
  while true; do
    if [[ `gpio -g read 18` -eq 1 ]]; then #PIR sensor activated
      if [[ $start -eq 0 ]]; then
        echo '[new Date('`date +"%Y, "`$((`date +%m`-1))`date
          +", %d, %H, %M, %S"`'), 0],' | tee -a
          /opt/GoogleVisualization/app/data.js
        sleep .5
        echo '[new Date('`date +"%Y, "`$((`date +%m`-1))`date
          +", %d, %H, %M, %S"`'), 1],' | tee -a
          /opt/GoogleVisualization/app/data.js
        start=1
      fi
    else #PIR sensor de-activated
      if [[ $start -eq 1 ]]; then
        echo '[new Date('`date +"%Y, "`$((`date +%m`-1))`date
          +", %d, %H, %M, %S"`'), 1],' | tee -a
          /opt/GoogleVisualization/app/data.js
        sleep .5
        echo '[new Date('`date +"%Y, "`$((`date +%m`-1))`date
          +", %d, %H, %M, %S"`'), 0],' | tee -a
          /opt/GoogleVisualization/app/data.js
        start=0
      fi
    fi
  done
}

setup; loop
excerpt of data.js
[new Date(2012, 10, 28, 08, 06, 30), 0],
[new Date(2012, 10, 28, 08, 06, 31), 1],
[new Date(2012, 10, 28, 08, 07, 10), 1],
[new Date(2012, 10, 28, 08, 07, 11), 0],
[new Date(2012, 10, 28, 08, 07, 16), 0],
[new Date(2012, 10, 28, 08, 07, 17), 1],
[new Date(2012, 10, 28, 08, 07, 22), 1],
[new Date(2012, 10, 28, 08, 07, 23), 0],
source for index.php
<?php
$hostname='bb.local';
$directory='/opt/GoogleVisualization/app/';
?>

<!DOCTYPE html PUBLIC "-//W3C//DTD XHTML 1.0 Strict//EN"
  "http://www.w3.org/TR/xhtml1/DTD/xhtml1-strict.dtd">
<html xmlns="http://www.w3.org/1999/xhtml">
<head>
  <meta http-equiv="content-type"
    content="text/html; charset=utf-8" />
  <title>Karl's Passive Infrared Sensor Graph</title>
  <script type="text/javascript"
    src="http://www.google.com/jsapi"></script>
  <script type="text/javascript">
    google.load(
      'visualization',
      '1',
      {packages: ['annotatedtimeline']}
    );

    function drawVisualization() {
      var data =
        new google.visualization.DataTable();

      data.addColumn('datetime', 'Date');
      data.addColumn('number', 'Status');

      data.addRows([
        <?php include ('data.js'); ?>
      ]);

      var annotatedtimeline = new
        google.visualization.AnnotatedTimeLine(
          document.getElementById('visualization')
        );
        annotatedtimeline.draw(
          data,
          {'displayAnnotations': true}
        );
    }

    google.setOnLoadCallback(drawVisualization);
  </script>
</head>
<body style="border: 0 none; font-family: Arial;">
  <h1>Karl's Passive Infrared Sensor Graph</h1>
  <div id="visualization" style="height: 300px; width: 900px;"></div>
  <br />
  <a href="http://<?php echo $hostname ?>/archive">Archive</a>
</body>
</html>
source for the maintenance script
#!/usr/bin/env bash

directory=$(date +"%Y-%m-%d")
sleep 60 #wait until midnight, cron is set for 23:59 as this keeps the directory names and dates aligned
mkdir /opt/GoogleVisualization/app/archive/$directory
mv /opt/GoogleVisualization/app/data.js /opt/GoogleVisualization/app/archive/$directory/
cp -pr /opt/GoogleVisualization/app/index.php /opt/GoogleVisualization/app/archive/$directory/

